weather
[D =] weather(lon=0.0, lat=0.0; city::String="", last=0, days=7, year::Int=0, starttime::Union{DateTime, String}="",
              endtime::Union{DateTime, String}="", variable="temperature_2m", dryrun=false, show=false, kw...)
Plot and/or retrieve weather data obtained from the Open-Meteo API. Please consult the site for further details. You will find that there are many variables available to plot and with not so obvious names. There are also forecast and archive versions of the variables. This function tries to guess that from the variable names. That list of variable names is a bit extensive and we are not reproducing it entirely here, but given it interest for climatological reason, we do list the so called \(daily\) variables.
variable: "temperature_2m_max", "temperature_2m_min", "apparent_temperature_max", "apparent_temperature_min",
"precipitation_sum", "rain_sum", "snowfall_sum", "precipitation_hours", "sunshine_duration", "daylight_duration", "wind_speed_10m_max", "wind_gusts_10m_max", "wind_direction_10m_dominant", "shortwave_radiation_sum", "et0_fao_evapotranspiration"
A word of aknowledge is also due to the WeatherReport.jl project that inspired this function, that is much smaller (~25 LOC) and has no further dependencies than GMT itself.
lonandlat: Explicitly provide the coordinates of the location. If not provided, nor thecityname, the current location is used from an IP location service (see thewhereamifunction help).city: The name of the location that will be used. City names are normally OK but if it fails see the help of thegeocoder()function as that is what is used to transform names to coordinates. The default is to use the current geographic location of the user.days: When asking for forecasts this is the number of days to forecast. Maximum is 16 days. Default is 7.starttime: Limit to events on or after the specified start time. NOTE: All times use ISO8601 Date/Time format OR a DateTime type. Default is NOW - 30 days.endtime: Limit to events on or before the specified end time. Same remarks as forstarttime. Default is present time.last: If value is an integer (e.g.last=90), select the events in the last n days. If it is a string than we expect that it ends with a 'w'(eek), 'm'(onth) or 'y'(ear). Example:last="2Y"(period code is caseless)year: An integer, restrict data download to this year.dryrun: Print the url of the requested data and return.data: The default is to make a seismicity map but if thedataoption is used (containing whatever) we return the data in aGMTdatasetfigname: savefig | figname | name :: [Type => Str]Save the figure with the
figname=name.extwhereextchooses the figure format (e.g. figname="name.png")show: By default this function just returns the data in aGMTdatasetbut ifshow=trueit shows the plot. Usedata=trueto also return the data even whenshow=true.
Examples
# Plot the temperature forecast of your location. Also returns the data table.
D = weather(data=true, show=true)
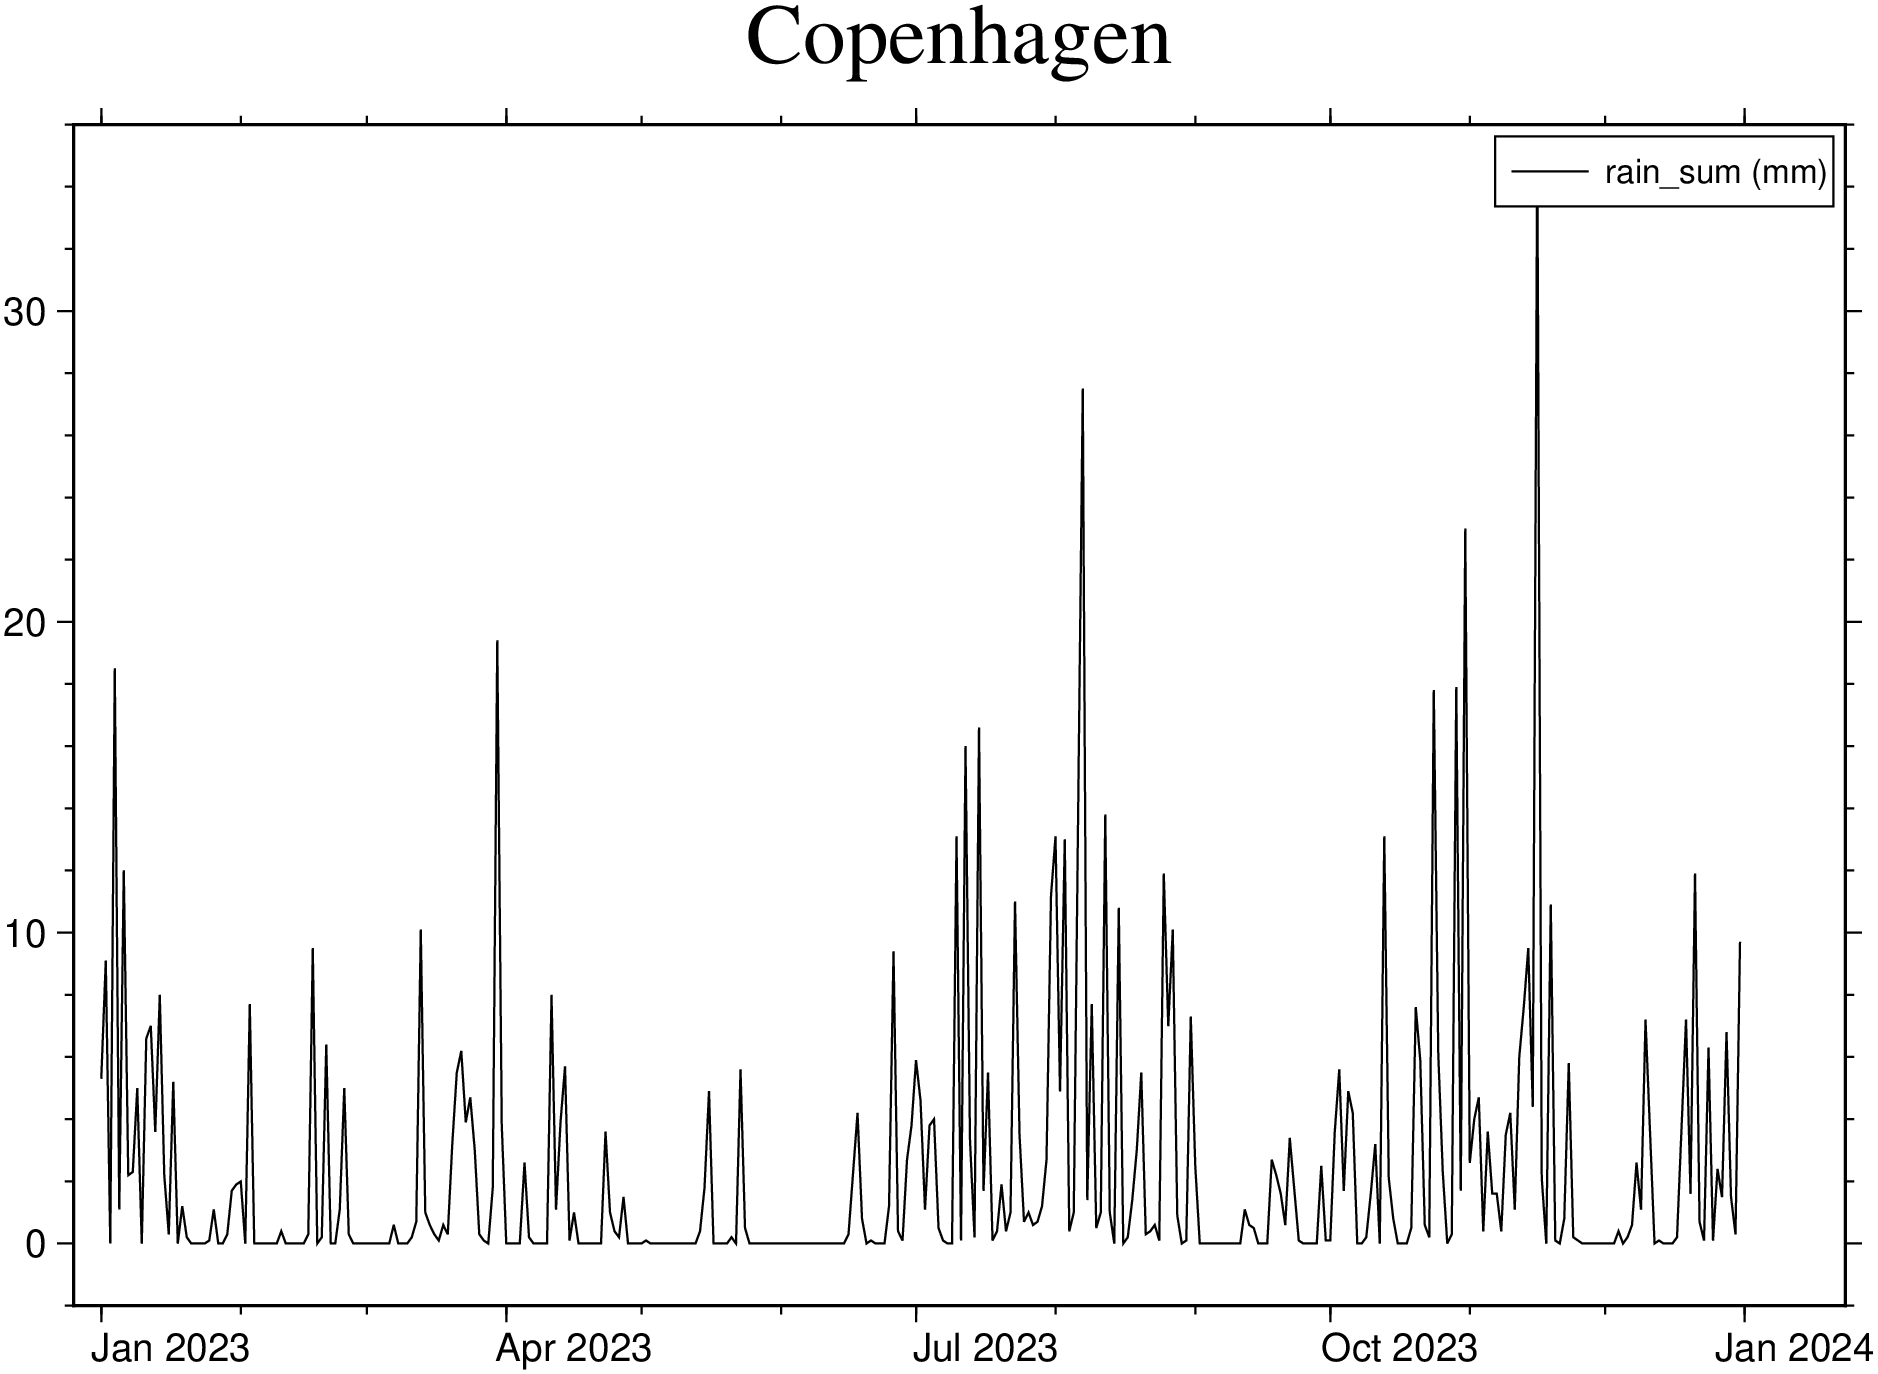
Plot the rain fall during 2023 at Copenhagen
using GMT
weather(city="Copenhagen", year=2023, variable="rain_sum", show=true)These docs were autogenerated using GMT: v1.33.1
